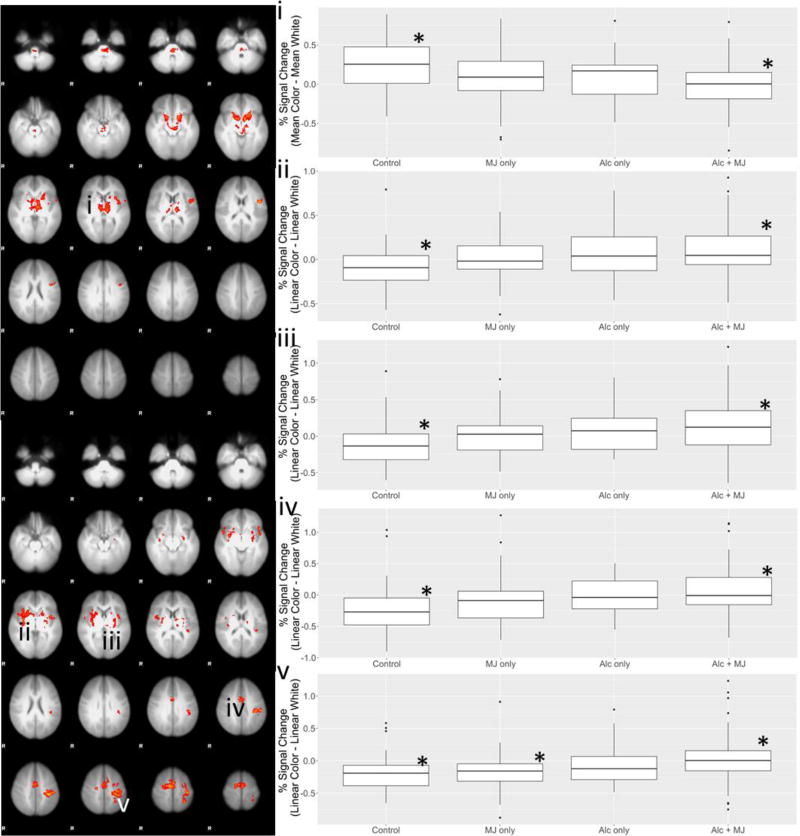
Figure 2.
Regions that showed differences in the omnibus test across group for the mean risk contrast (a) and the linear risk contrast (b). Panels i-v display the signal change values by group within the regions in panels (a) and (b) showing group differences (significant differences are denoted by * for each ROI).

