
Figure 1.
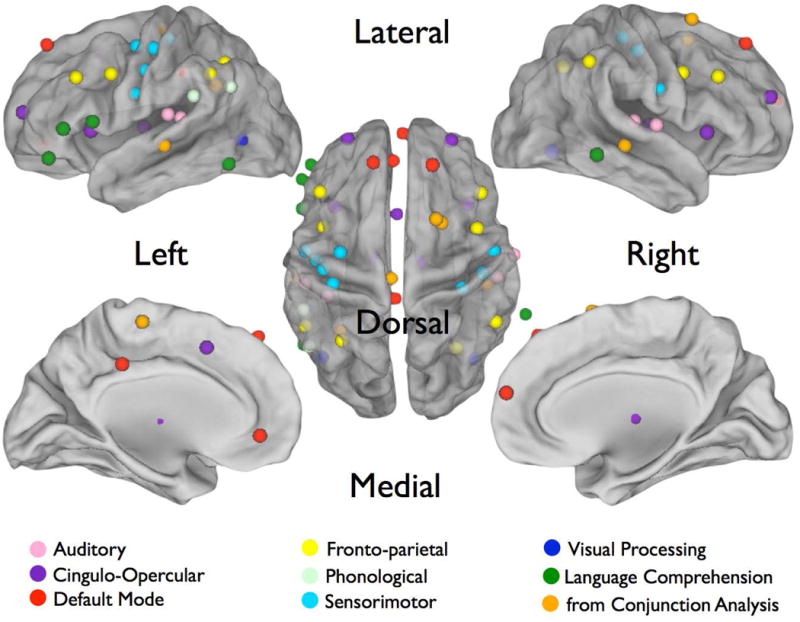
Seed regions from Table 1 projected onto a brain surface. Auditory regions are shown in pink, CON in purple, DMN in red, FPN in yellow, phonological in light blue, sensorimotor in blue, visual processing in deep blue, language network in green, and conjunction analysis in oranage. Representative dots are larger than the actual 10mm spheres used in analysis for ease of visualization.