
Figure 7.
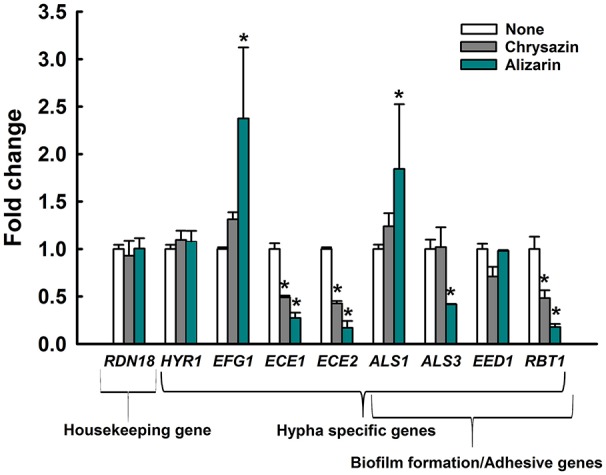
Transcriptional profiles of C. albicans cells treated with or without alizarin and chrysazin. C. albicans was cultivated with or without alizarin (2 μg/ml) for 4 h. Transcriptional profiles were measured by qRT-PCR. Relative expressions represent transcriptional levels after treatment with alizarin as compared to non-treated controls. Fold changes represents transcription changes in treated C. albicans vs. non-treated controls (value of 1.0). The experiment was performed in duplicate. Error bars indicate standard deviations. *p < 0.05 vs. non-treated controls.