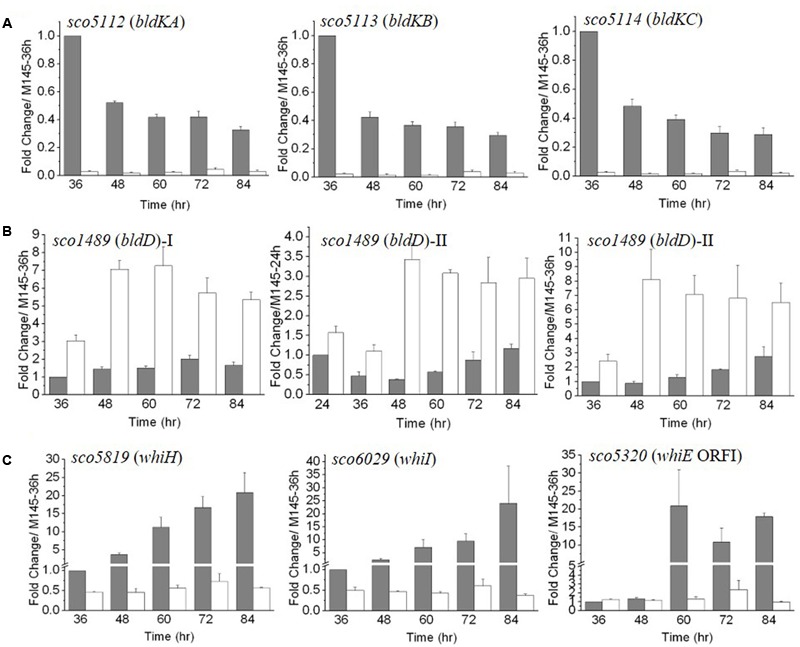
FIGURE 4.

The temporal expression of bld (A,B) and whi (C) genes in ΔmtrA. Gene expression in M145 and ΔmtrA was determined by real-time PCR analysis. RNA samples were isolated from M145 and ΔmtrA and analyzed as described for Figure 3. The y-axis shows the fold change in expression level in M145 (gray bars) and ΔmtrA (light bars) over the level of M145 at 36 or 24 h (arbitrarily set to one). Results are the means (± SD) of triplet experiments.
