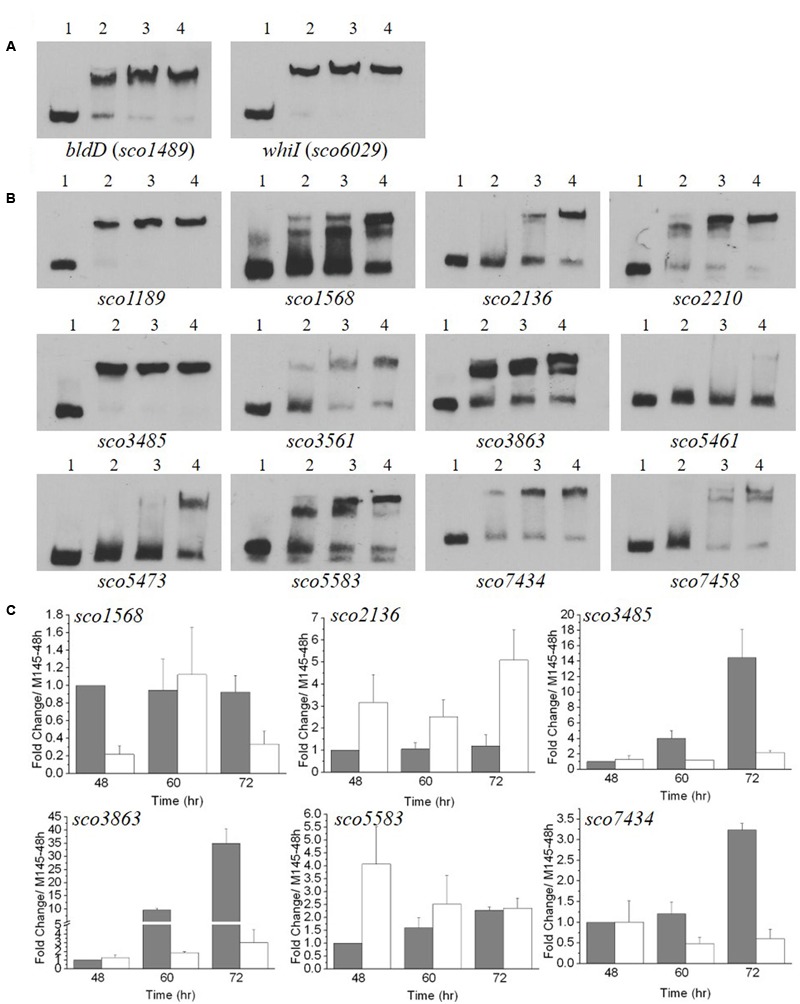
FIGURE 6.

Electrophoretic mobility shift assays (EMSA) and transcriptional analysis of genes with upstream sequences similar to the MtrAMTB recognition sequence. (A,B) EMSA analyses with MtrASCO and 59-bp oligonucleotides containing sequences similar to the MtrAMTB recognition sequence. A fixed amount of labeled oligonucleotide was incubated in reactions containing no MtrA (lane 1), or 1.6 or 3.2, or 4.8 μg MtrA (lanes 2, 3, and 4, respectively). (A) Analysis with sequences upstream of bldD and whiI that were protected by MtrASCO in DNase I footprinting (see Figure 5). (B) Analysis with sequences identified in a genome-wide search for matches to the MtrAMTB consensus recognition sequence. The sequences were located upstream of the named genes. (C) Transcriptional analysis of potential MtrASCO target genes in the ΔmtrA mutant. M145 and ΔmtrA were grown on YBP solid medium, and RNA samples were isolated at the indicated times. Expression of hrdB, encoding the major sigma factor in M145, was used as an internal control. The y-axis shows the fold change in expression level in M145 (gray bars) over the level of ΔmtrA (light bars) at each time point, which was arbitrarily set to one. Results are the means (± SD) of triplet experiments.
