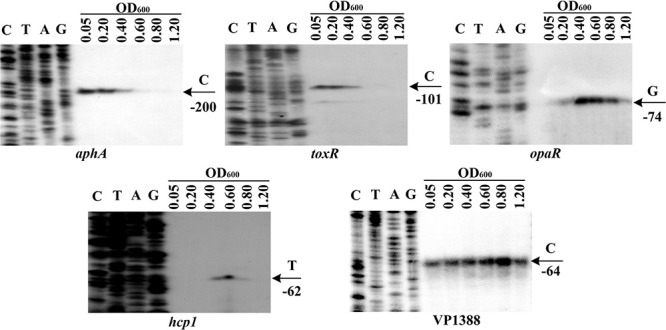
FIGURE 1.

Cell density-dependent expression of target genes. Lanes C, T, A, and G represented Sanger sequencing reactions. The WT cells were harvested at various OD600 values. An oligonucleotide primer was designed to be complementary to the RNA transcript of each gene tested. The primer extension products were analyzed with an 8 M urea-6% acrylamide sequencing gel. The transcription start sites were indicated by arrows with nucleotides and positions.
