Figure 5.
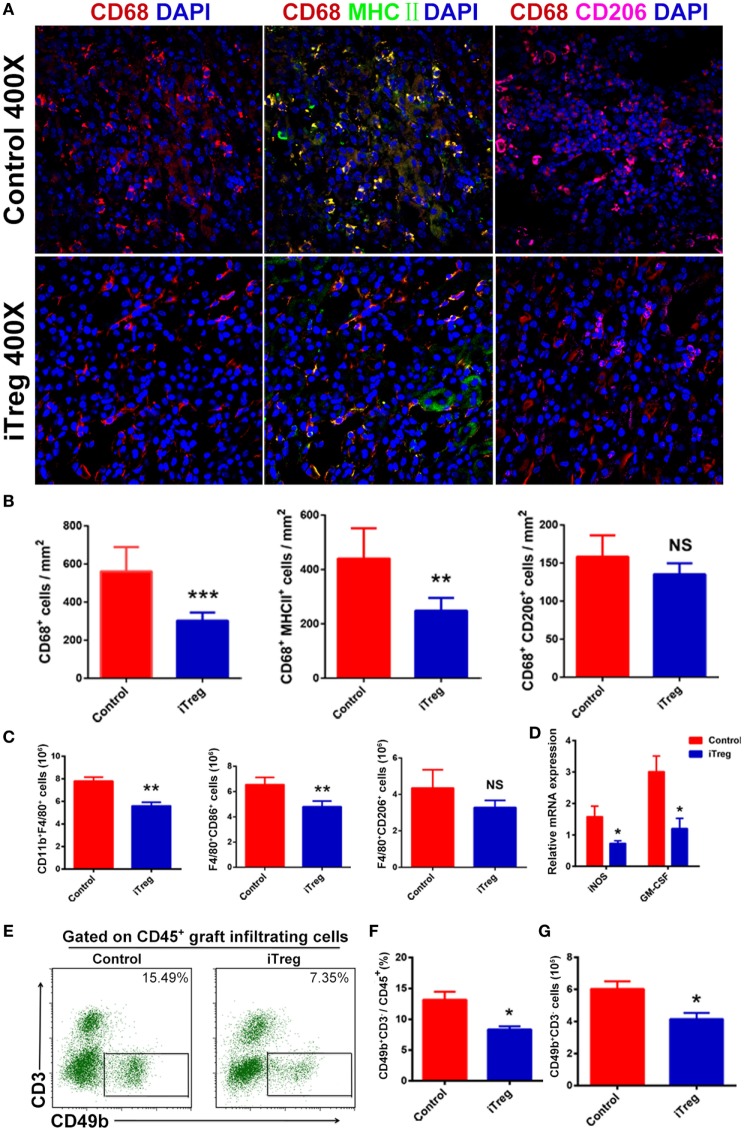
iTreg treatment reduces M1 macrophage and natural killer cell (NK cell) infiltration in renal allografts after transplantation. Renal allografts were obtained at 5 days post operation. (A) Immunofluorescence staining of graft-infiltrating macrophages, macrophages were determined by staining for DAPI and CD68. Merged fluorescence (yellow) of double staining for CD68 (red) and MHCII (green) determined M1. Merged fluorescence (amaranth) of double staining for CD68 (red) and CD206 (purple) determined M2; (B) cell counts from immunofluorescence staining in showing CD68+ (M), CD68+MHCII+ (M1), and CD68+CD206+ (M2) cells per square millimeter. Data are shown as mean ± SD of three independence samples; (C) absolute number of macrophages (F4/80+CD11b+) including M1 (F4/80+CD86+) and M2 (F4/80+CD206+) in grafts by flow cytometry. Data are shown as mean ± SD of four grafts; (D) the mRNAs expressions of iNOS and GM-CSF detected by qPCR; (E) detection of NK cells (CD49b+CD3−) among CD45+ cells in grafts by flow cytometry. (F) Relative percentage of CD49b+CD3− cells among the CD45+ cells in the grafts. Data are shown as mean ± SD of four transplants. (G) Absolute number of CD49b+CD3− cells infiltration in the grafts. Data are shown as mean ± SD of four grafts (*p < 0.05).

