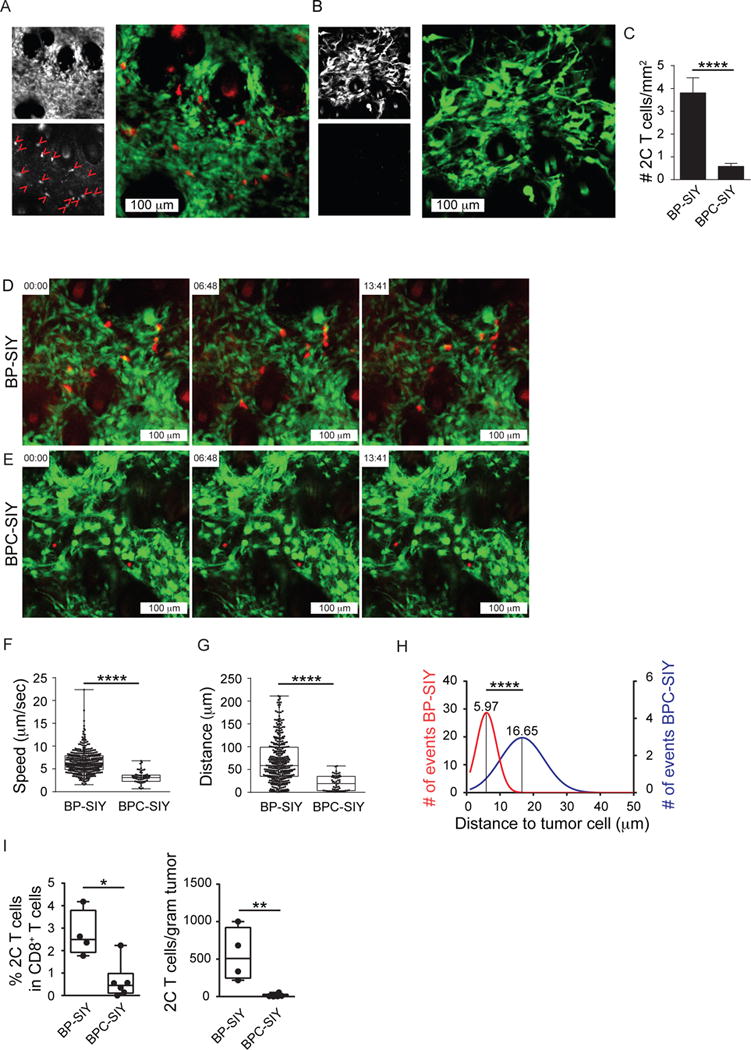
Figure 4. Effector T cells associated with BP-SIY tumors show enhanced motility and interaction with tumor cells compared to T cells infiltrating BPC-SIY tumors.

(A, B) Representative images depicting tumor (YFP) and adoptively transferred 2C T cells (deep red) as single channel and merge of BP-SIY tumor (A) and BPC-SIY tumor (B). T cells are highlighted in the red channel with red arrowheads (16 in BP-SIY vs. 0 in BPC-SIY). (C) Numbers of adoptively transferred effector 2C T cells assessed in BP-SIY and BCP-SIY tumors 72 hr post transfer (total of 20 field of view/ genotype were analyzed from 3 independent experiments). Data are shown as mean with SEM. (D, E) Representative images selected from Movie 1 showing 2C effector T cell migrating in BP-SIY (D) or BPC-SIY (E) tumors. (F, G) Velocity (speed, μm/sec) (F) and displacement (distance, μm) (G) of tumor-infiltrating effector 2C T cells assessed 48–72 hr post adoptive transfer (n= 357 (BP-SIY) and 55 (BPC-SIY), pooled out of 20 movies obtained from 3 independent experiments, shown are mean with 95th percentile). (H) Histogram of mean distance between T cell (center) and nearest tumor cell (edge), interaction larger the 50 μm were disregarded (n= 126 (BP-SIY) and 96 (BPC-SIY), pooled out of 40 images obtained from 3 independent experiments). (I) The amount of detectable 2C T cells within the tumor 3 days post adoptive transfer of 1×10⁶ in vitro activated T cells. Left panel shown percent within CD8 T cells and right panel depicts amount total 2C T cells per gram tumor. Box plots show median with 95th percentile, maximal deviation shown by error bars, n = 4 and 6 for BP-SIY and BPC-SIY, respectfully. The tumor weight at time of analysis was 1.65 g ± 0.16 g for BP-SIY and 1.46g ± 0.2 g for BPC-SIY (mean ± SD). Significance was assumed with p ≤ 0.05, with * ≤ 0.05; ** ≤ 0.01; **** ≤ 0.0001. See also Figure S3 and Movies S1–S3.
