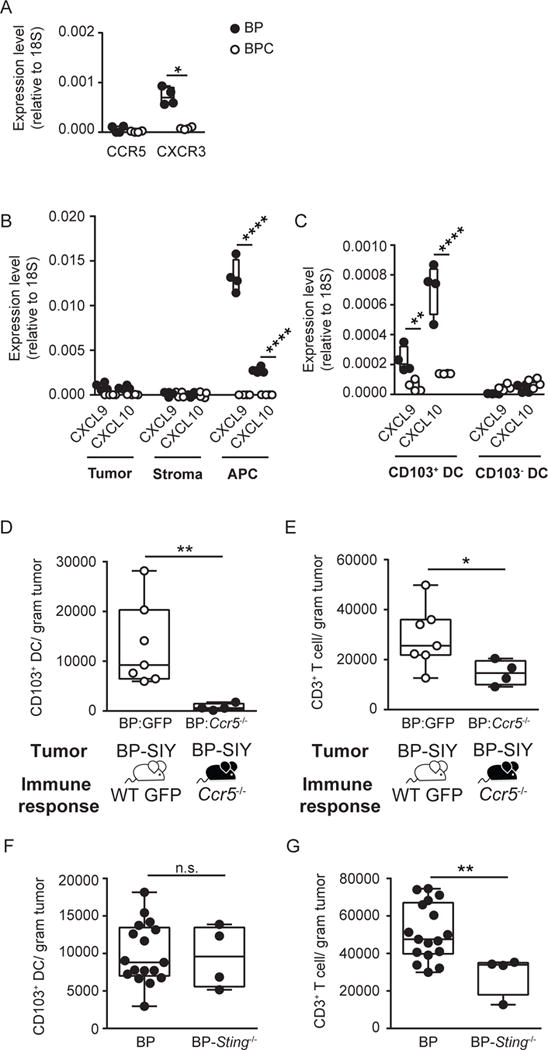
Figure 6. CXCR3-CXCL9/10 chemokine axis and the presence of CD103+ dendritic cells are associated with the presence of T cells in the TME.

(A) Expression level of chemokine receptors CCR5 and CXCR3 on tumor-infiltrating T cells isolated from BP (filled) and BPC (open) tumors. Expression was assessed on T cells isolated from two tumors per data point via quantitative real-time PCR and normalized to 18S (n = 4; data are pooled out of two independent experiments). The tumor weight at time of analysis was 1.5 g ± 0.15 g for BP and 1.8 g ± 0.28 g for BPC (mean ± SD). (B, C) Expression level of CXCL9 and CXCL10 in tumor (CD45−, YFP+), stroma (CD45−, YFP−) and ACP (CD45+, MHCII+, CD11c+) (B) and on CD103+ and CD103− DC (MHCII+, CD11c+, CD103/CD8α−) (C) isolated from BP (filled) and BPC (open) tumors (n =4; data are pooled out of two independent experiments). The tumor weight at time of analysis across all experiments was 1.4 g ± 0.1 g for BP and 2 g ± 0.14 g for BPC (mean ± SD). (D, E) Ccr5−/− (black circles) and control (GFP, grey circles) bone marrow chimeras with BP hosts were generated and following tumor induction the amount of tumor infiltrating CD103+ DC (D) and CD3+ T cells (E) were assessed and are depicted as number /gram tumor (n = 7 and 4; data are pooled out of two independent experiments). The tumor weight at time of analysis was 0.7 g ± 0.08 g for control chimeras and 0.8 g ± 0.2 g for Ccr5−/− chimeras. (F, G) Absolute amount of CD103+ DC (F) and CD3+ T cells (G) detected in BP (WT) and BP-Sting−/− tumors. The tumor weight at time of analysis was 1.8 g ± 0.5 g for BP and 2.3 g ± 0.6 g for BP-Sting−/− (mean ± SD). Box plots show median with 95th percentile, maximal deviation shown by error bars; significance was assumed with p ≤ 0.05, with * ≤ 0.05, ** ≤ 0.01, **** ≤ 0.0001. See also Figure S4.
