
Figure 8. Batf3-driven DC gene signature correlates with CXCL9/10/11 expression and effector T cell gene signature in human melanoma patients.
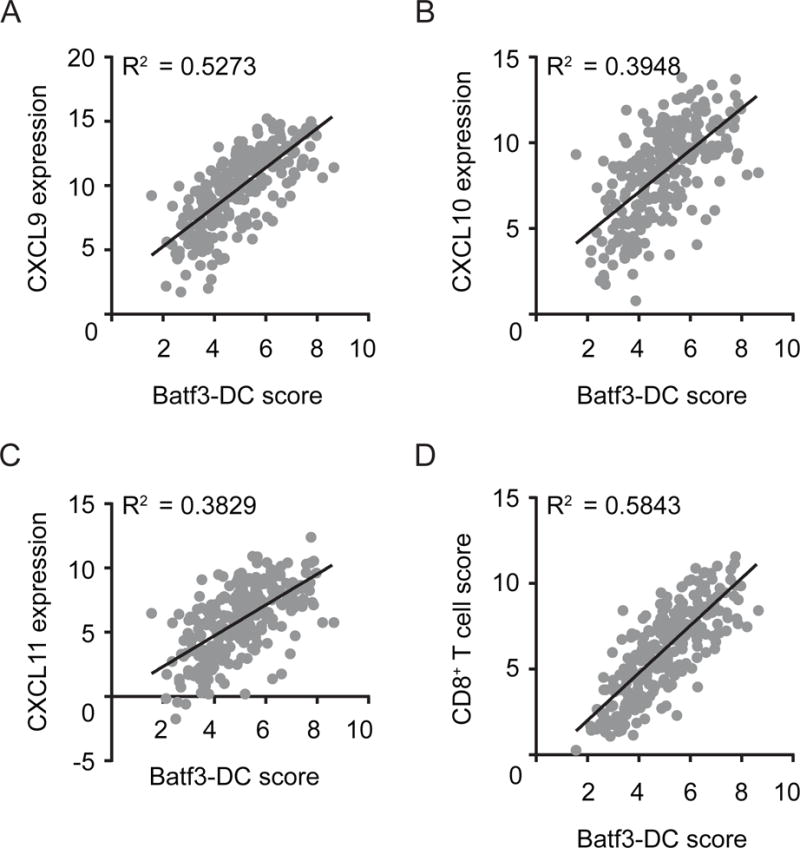
(A–C) Gene expression (normalized and log2 transformed) of CXCL9 (A) CXCL10 (B) and CXCL11 (C) from 266 human metastatic melanoma samples were plotted against a Batf3-DC score. (D) Correlation between the CD8+ effector T cell score and the Batf3-DC score. Correlation is shown using R2 and significance was determined using a Spearman correlation (p< 0.0001 for all correlations).