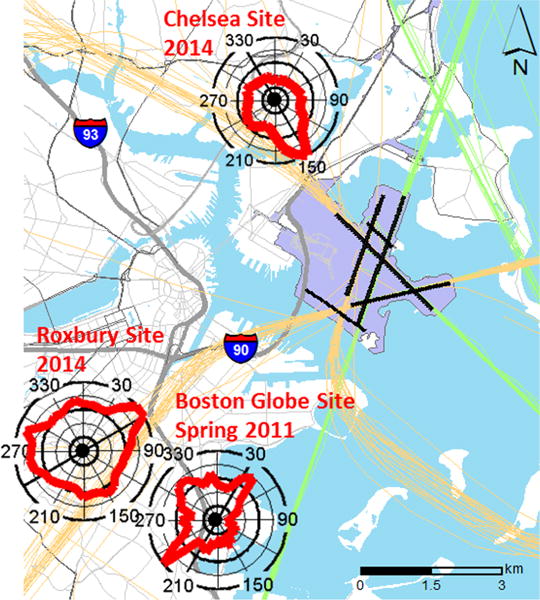
Figure 2.

Hourly average baseline PNC roses (normalized to the maximum) for the three monitoring sites. Typical trajectories for frequently used runways for landings are shown in green, and takeoffs are shown in tan. Base layers for the map were obtained from mass.gov.
