
Figure 3.
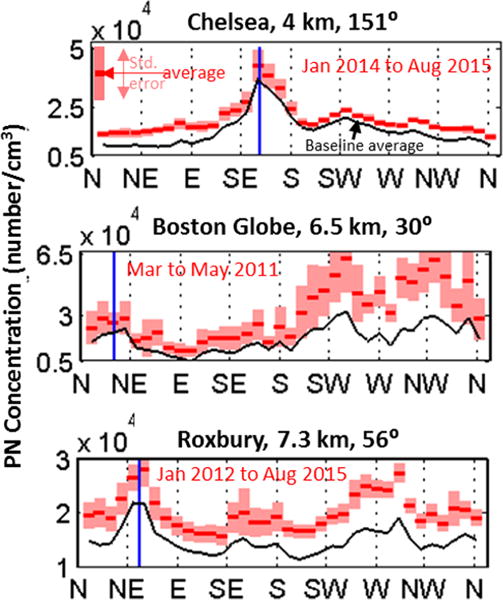
Hourly average PNC aggregated by 10° wide wind-direction sectors. Sector-average PNCs are plotted as dark red lines, and ±1 standard error is shaded red. Sector-average baseline PNCs are shown as a black line. The azimuth angle between the site and the airport is indicated by the vertical blue line.