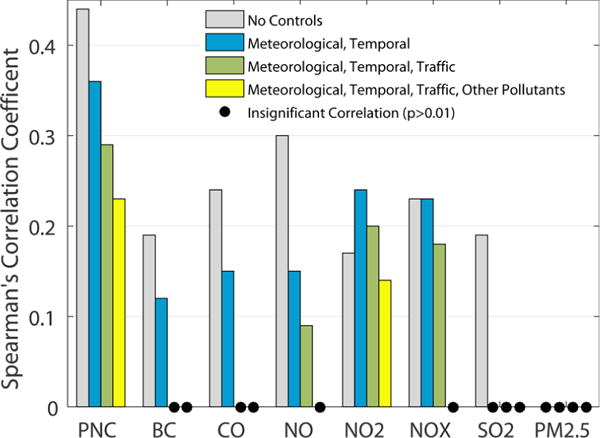
Figure 6.

Spearman’s partial correlation coefficients between LTO and hourly average pollutant concentrations at the Roxbury site controlling for different sets of variables (see Table S5 of the Supporting Information). Insignificant correlations (p > 0.01) are marked as black dots.
