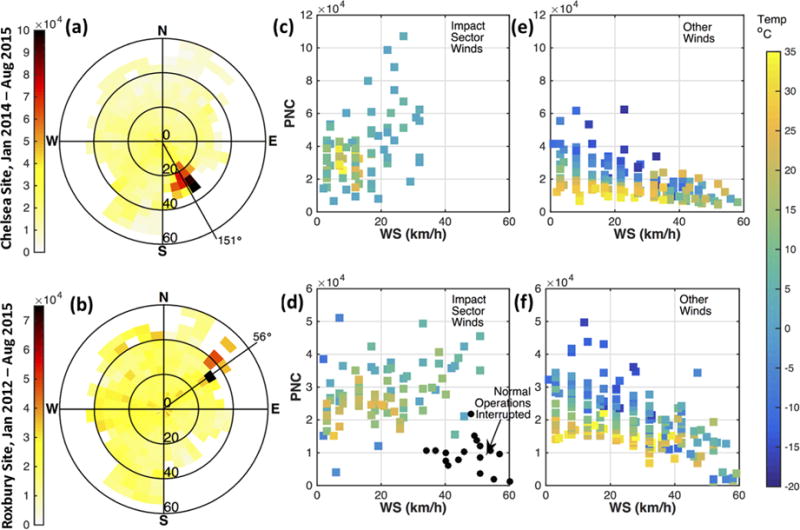
Figure 7.

(a and b) PNC roses. The radial axis represents wind speed (km h−1), and the angular coordinate represents wind direction. The azimuth angle of the airport from the sites is marked. (c–f) PNC dependence upon wind speed for impact-sector winds and all other directions. For visual clarity, hourly average PNCs were aggregated in 3.6 km h−1 (1 m s−1) and 5 °C bins, and bin averages are plotted against wind speed. (d) Hours (not bin averages) corresponding to times when normal flight operations were interrupted by two extreme weather events are marked with black dots (also see Figures S11–S14 of the Supporting Information).
