
Figure 1.
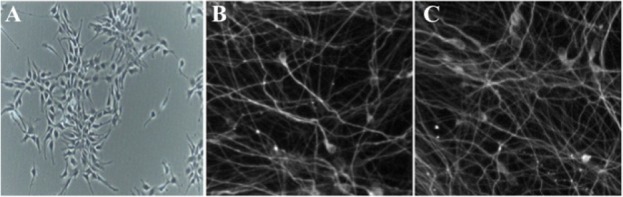
Phase contrast and fluorescence images of cultured and differentiated RenVm cells. RenVm cells at the beginning of the neural differentiation (A). The differentiated RenVm cells four (B) and eight (C) days after the beginning of differentiation. Scale bars represent 200 μm in A and 100 μm in B and C.