Figure 2.

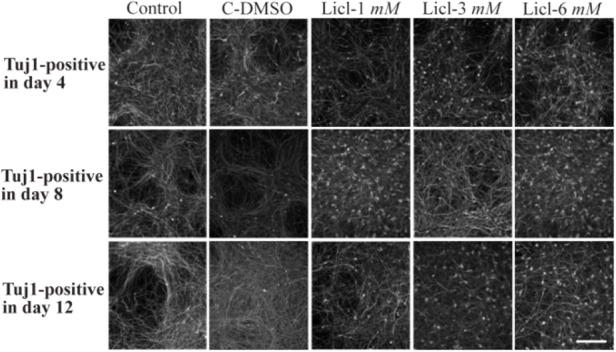
Immunocytochemistry images of differentiated cells which expressed Tuj1 marker in different concentrations of lithium (1 mM, 3 mM, 6 mM), control and in DMSO control (C-DMSO) groups. Scale bar represents 100 μm.

Immunocytochemistry images of differentiated cells which expressed Tuj1 marker in different concentrations of lithium (1 mM, 3 mM, 6 mM), control and in DMSO control (C-DMSO) groups. Scale bar represents 100 μm.