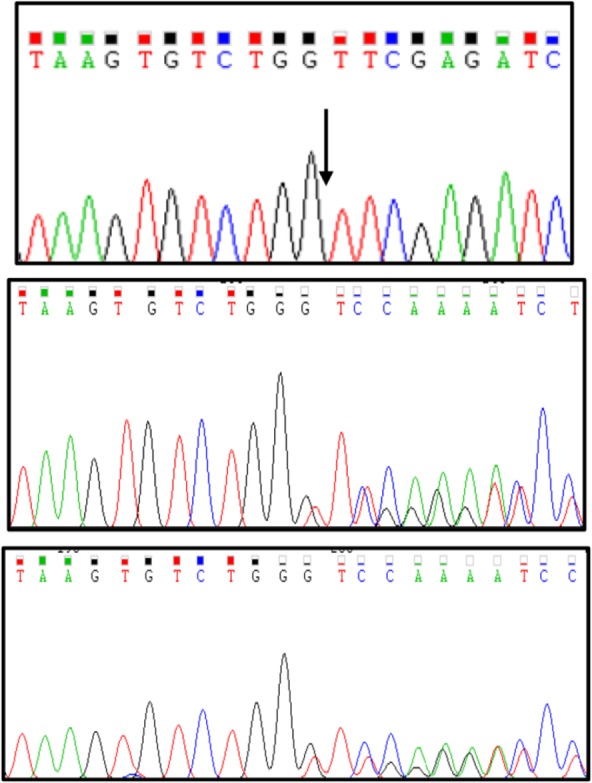
Figure 2.

Sanger sequencing chromatograms showing the nucleotide deletion found in the patient in homozygous (Top panel; the arrow represents deletion of G between G and T) and in her parents in heterozygous states. Middle and bottom panels show her father and her mother sequences, respectively.
