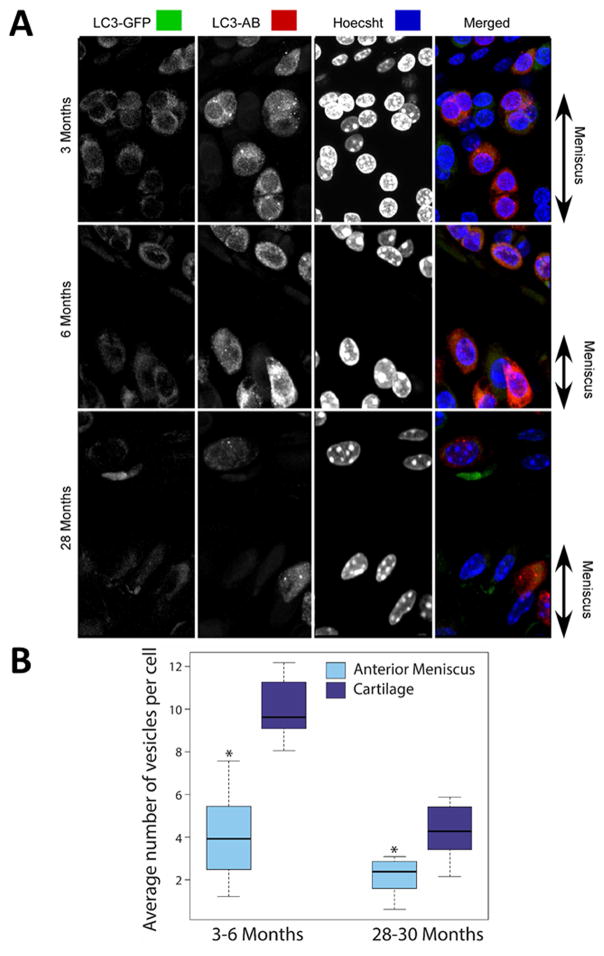
Fig. 1.
Autophagosome formation in meniscus from GFP-LC3 transgenic mice. Vibratome cut sagittal sections (70 μm) of mouse knee joints were stained with anti-LC3 antibody (AB) and Hoechst 33342 to label nuclei and were analyzed by confocal microscopy. (A) Representative images of GFP-LC3 signal in 3-, 6-, and 28-month-old mice showing the surface superficial layer of meniscus for each condition. Original magnification = 63X. (B) Quantitative analysis of autophagosomes presented as average number of autophagic vesicles per cell. Box and whisker plots (5 mice per group); * = P < 0.05 meniscal cells versus cartilage cells.

