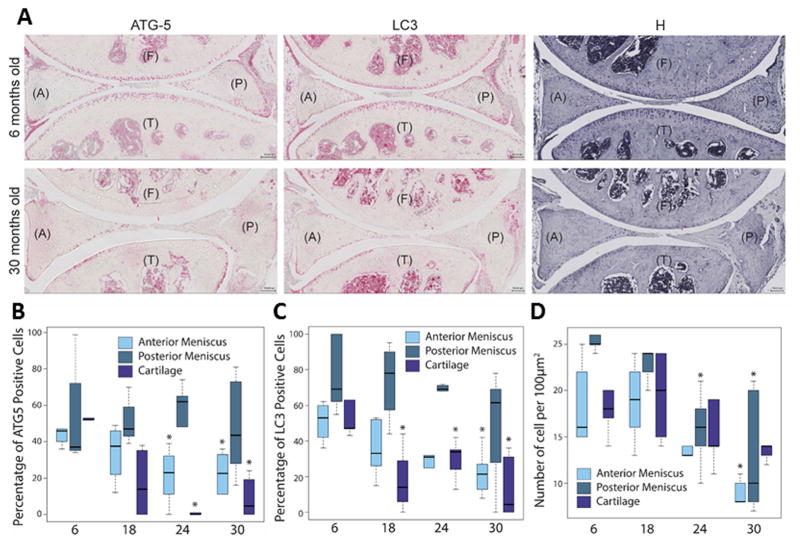
Fig. 2.
Age-related changes in ATG-5 and LC3 expression and cellularity. Immunohistochemistry for ATG-5 and LC3 were performed on mouse knee joint sections. (A) Representative images of knee joints from 6- and 30-month-old mice stained with ATG-5, LC3, and Hematoxylin (H), showing the anterior (A) and posterior meniscus, femur (F) and tibia (T). Original magnification = 10X, Scale bar = 100 μm. Quantitative analysis of ATG-5 (B) and LC3 (C) positive cell density per 100 μm2 area. Hematoxylin (H) stained sections were analyzed by total cell density per 100-μm2 area (D). Results show a significant decrease in ATG-5 and LC3 cell number and reduced cellularity. Box and whisker plots (5 mice per group); * = P < 0.05 versus 6-month-old mice.

