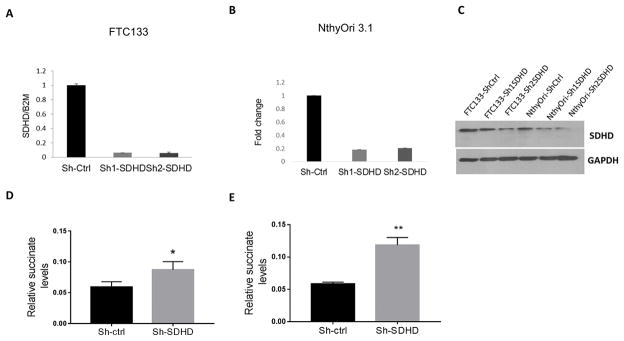
Figure 2. SDHD depletion leads to succinate accumulation in vitro.
A. Quantification of SDHD knockdown in FTC133 by RT-PCR. Gene expression is normalized to B2M. B. Quantification of SDHD knockdown in NthyOri 3.1 by RT-PCR. Gene expression is normalized to B2M. C. Western blot showing SDHD knockdown in lentivirus transfected thyroid cell lines in FTC133 and NthyOri 3.1. D. Quantification of relative succinate levels in FTC133 cells analyzed by mass spectrometry. Data represents average of four biological replicates. E. Quantification of relative succinate levels in NthyOri 3.1 cells analyzed by mass spectrometry. Data represents average of four biological replicates. Error bars represents standard deviation (SD). Statistical analyses were performed by two-tailed Student’s t-test (*P value ≤ 0.05, **P value ≤ 0.01).

