
Figure 4.
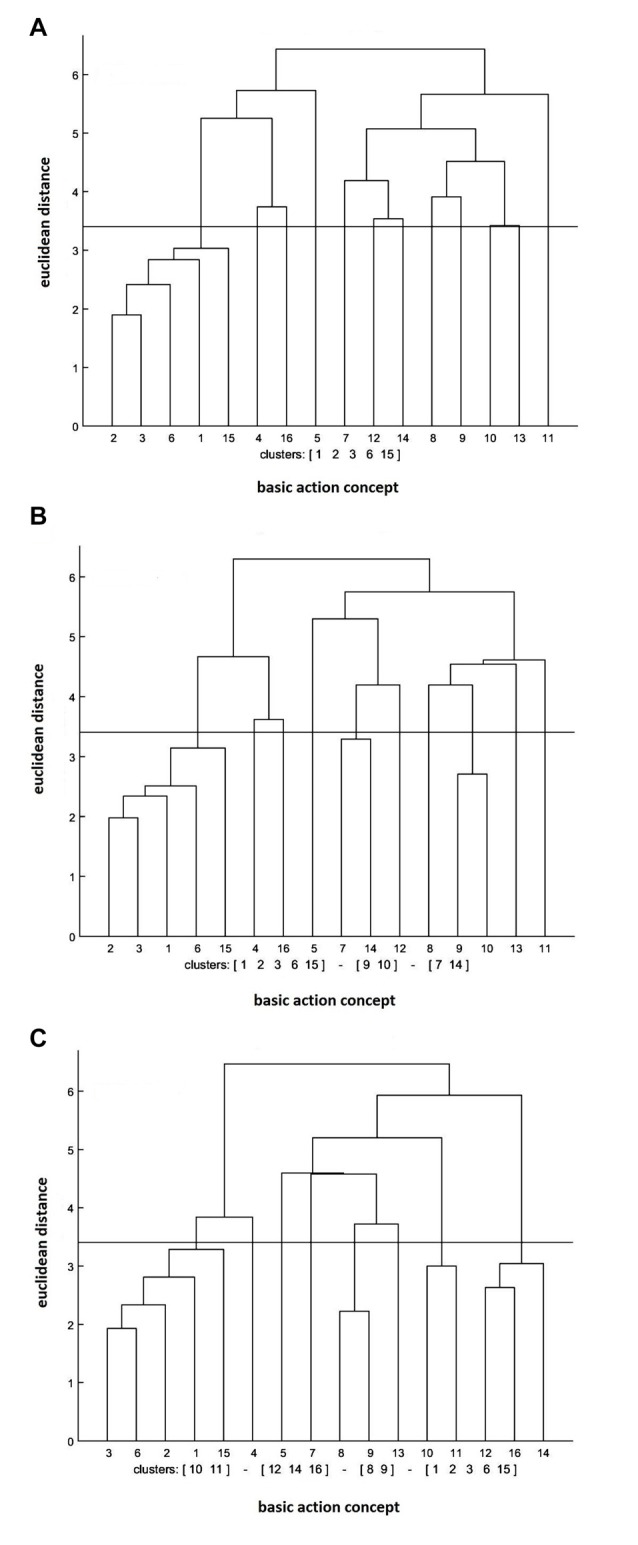
Mean dendrograms indicating mental representation structure of control group at (A) pre-test, (B) post-test and (C) retention test (α = 0.05; dcrit = 3.41).
Official websites use .gov
A
.gov website belongs to an official
government organization in the United States.
Secure .gov websites use HTTPS
A lock (
) or https:// means you've safely
connected to the .gov website. Share sensitive
information only on official, secure websites.
Mean dendrograms indicating mental representation structure of control group at (A) pre-test, (B) post-test and (C) retention test (α = 0.05; dcrit = 3.41).