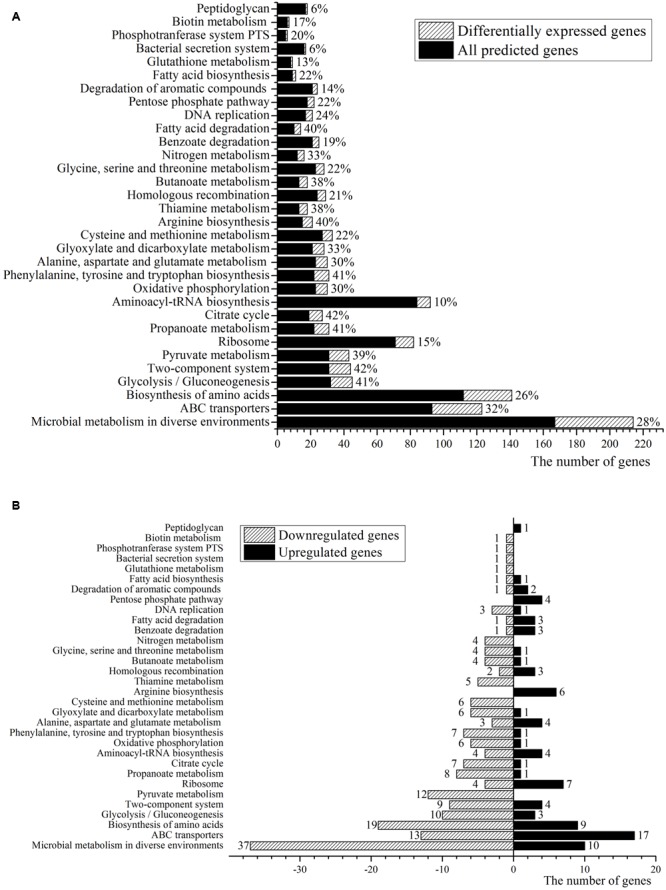
FIGURE 2.

Pathway gene ontology enrichment analysis. (A) The ratio of the DEGs in the total number of genes detected. (B) The numbers of the DEGs.

Pathway gene ontology enrichment analysis. (A) The ratio of the DEGs in the total number of genes detected. (B) The numbers of the DEGs.