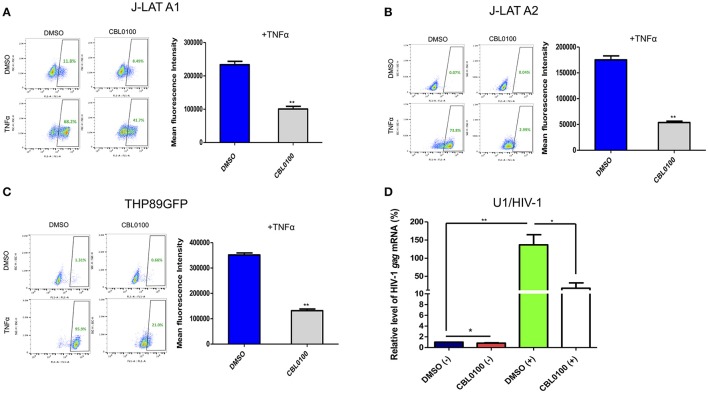
Figure 2.
CBL0100 blocks HIV-1 reactivation in latency cell lines. (A) J-LAT-A1 cells were treated with TNFα (10 ng/ml) or mock treated in the presence of 0.1 μM CBL0100 or 0.1% DMSO for 24 h. GFP+ cells were sorted by flow cytometry. Mean fluorescence intensity (MFI) is measured in GFP+ cells and results are shown on right. Data obtained from three independent experiments (mean ± s.e.m., *p < 0.05, **p < 0.01, ***p < 0.001, Student t-test). (B) J-LAT-A2 cells were subjected to the same assay as in (A). (C) THP89GFP cells were subjected to the same assay as in (A) except that 0.2 μM CBL0100 was used. (D) U1/HIV-1 cells were treated with 10 ng/ml TNFα (+) or mock treated (–) and co-treated with either 0.1% DMSO or 0.1 μM CBL0100 for 24 h. Total mRNA was extracted and subjected to the qPCR assay that measures the mRNA level of HIV-1 gag. GAPDH was used as the reference. The normalized mRNA level of HIV-1 gag from all tested samples are represented as relative to DMSO (–). Data is the average of three independent experiments (mean ± s.e.m., *p < 0.05, **p < 0.01, ***p < 0.001, student t-test).

