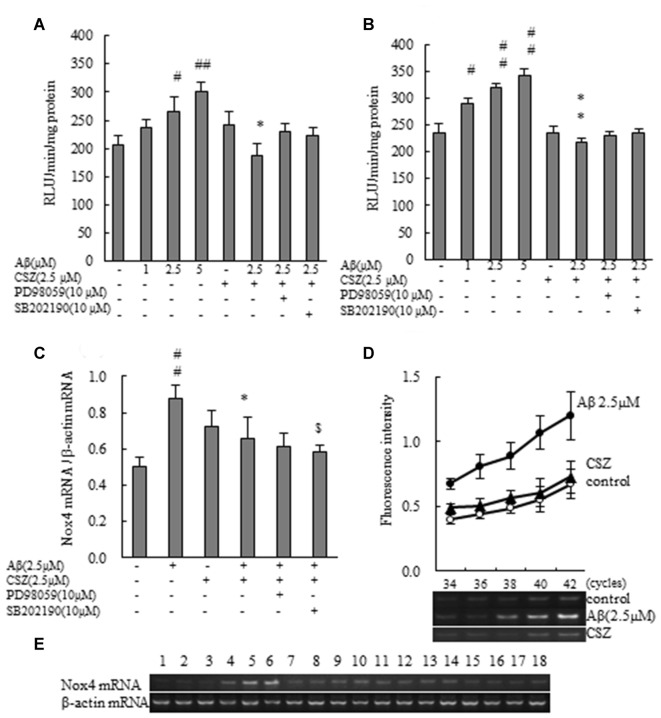
Figure 4.
Effect of CSZ on Nox activity and the mRNA expression analysis of NOX4 in Aβ-stimulated SH-SY5Y cells. (A) Nox activities were determined in SH-SY5Y cells incubated with or without 1 h pretreatment with CSZ or inhibitor of MEK1/2 or p38 MAPK followed by 1 h incubation with Aβ. Values are expressed as mean + SEM. (B) Nox activities were determined in SH-SY5Y cells incubated with or without 1 h pretreatment with CSZ or inhibitor of MEK1/2 or p38 MAPK followed by 20 h incubation with Aβ. Values are expressed as mean + SEM. (C) The mRNA expression analysis of NOX4 in treated SH-SY5Y cells are examined. The effects of respective inhibitor were also examined. Values are expressed as mean + SEM. (D) Reaction cycles-PCR product yield curves of each reaction mixture were plotted. (E) Picture shows the bands obtained in agarose gel electrophoresis for Nox4 and β-actin. Lane1–3: control, Lane4–6: 2.5 μM Aβ, Lane7–9: 2.5 μM CSZ, Lane10–12: 2.5 μM Aβ + 2.5 μM CSZ, Lane13–15: 2.5 μM Aβ + 2.5 μM CSZ + 10 μM PD98059, Lane16–18: 2.5 μM Aβ + 2.5 μM CSZ + 10 μM SB202190. #Compared vs. respective control cells (p < 0.05). ##Compared vs. respective control cells (p < 0.01). *Compared vs. Aβ-treated cells (p < 0.05). **Compared vs. Aβ-treated cells (p < 0.01). $Compared vs. Aβ + CSZ-treated cells (p < 0.05).

