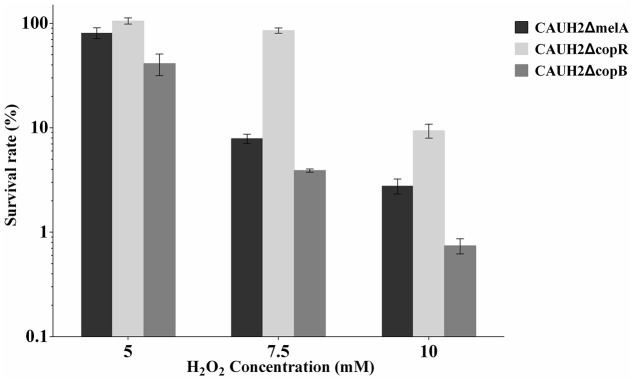
FIGURE 4.
Survivals of the CAUH2ΔcopR and CAUH2ΔcopB mutants following 5, 7.5, and 10 mM H2O2 challenge. Survival rates were calculated as the ratio of the number of colonies obtained on MRS plates after and before H2O2 challenge. Data are averages from three independent experiments, and error bars indicate SD.

