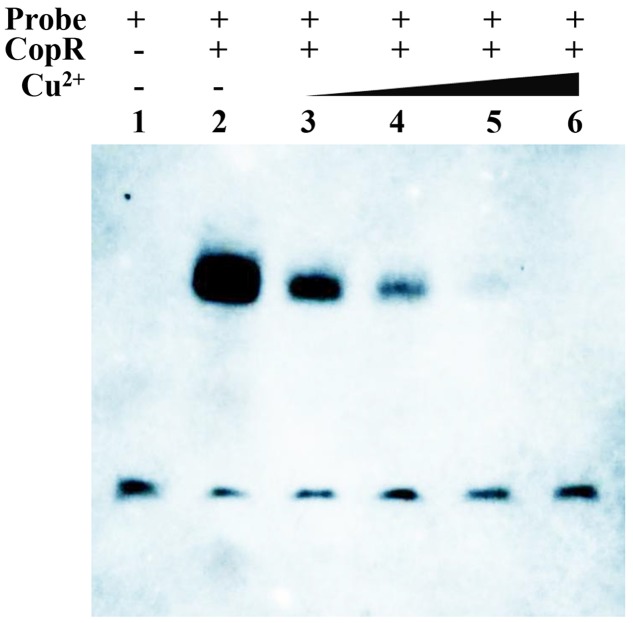
FIGURE 8.
EMSAs showing the interaction of CopR and the predicted binding sites upstream of copB in the presence of different concentrations of Cu2+. Binding reactions consisted of the following: lane 1, 20 fmol labeled probe alone; lane 2, 20 fmol labeled probe and 2.5 μg CopRHis6; lane 3, 20 fmol labeled probe and 2.5 μg CopRHis6 and 5 μM Cu2+; lane 4, 20 fmol labeled probe, 2.5 μg CopRHis6, and 10 μM Cu2+; lane 5, 20 fmol labeled probe, 2.5 μg CopRHis6, and 20 μM Cu2+; and lane 6, 20 fmol labeled probe, 2.5 μg CopRHis6, and 50 μM Cu2+.

