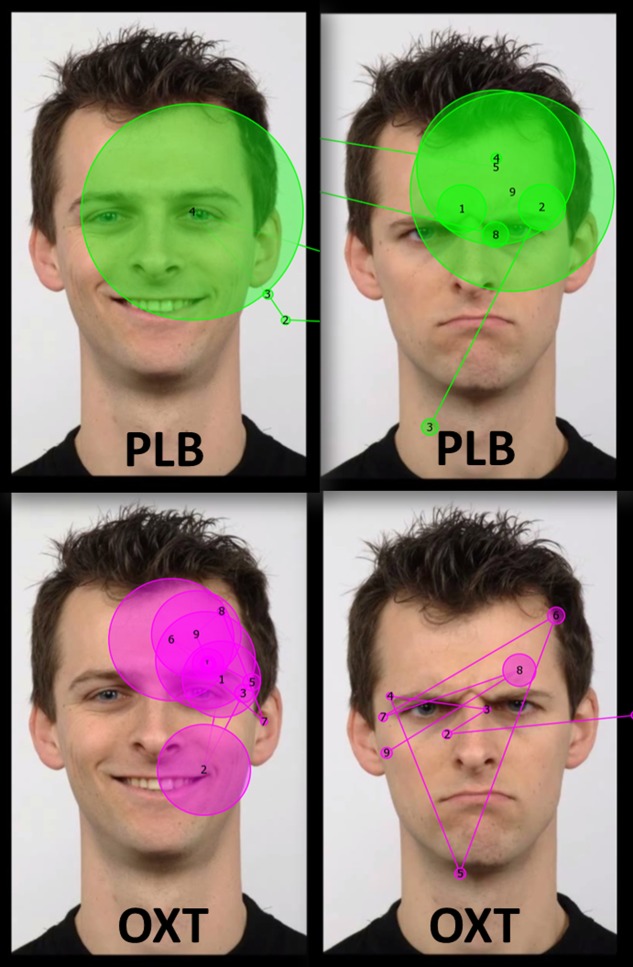
FIGURE 1.
Examples of the stimuli images (from Radboud faces database; Langner et al., 2010) and scan paths of one dog during 7000 ms viewing after the placebo (PLB) and the oxytocin treatments (OXT). The dotted white rectangular area in the top left image represents the analyzed area of interest. Circles represent the gaze fixations of one dog and the lines trace the path that the gaze traveled across the image. Circle size is proportional to the fixation time. The numbers in the circles represent the order of the fixations.

