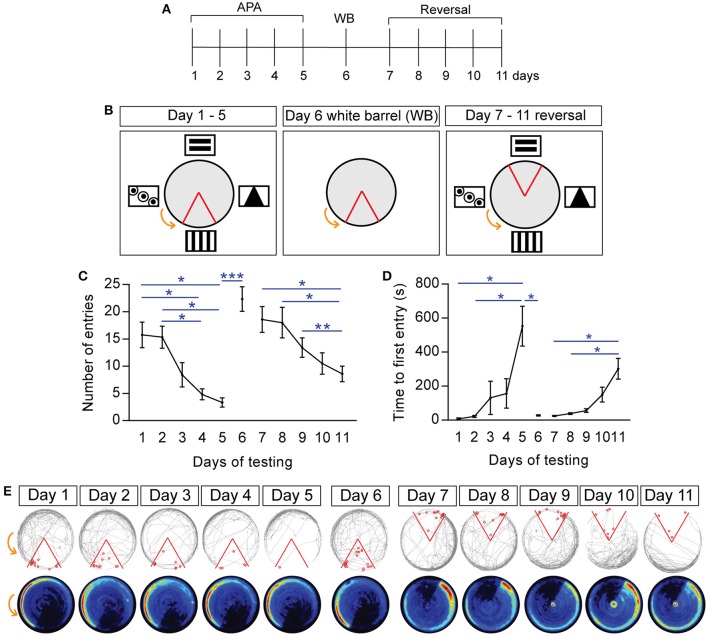
Figure 2.
Spatial learning and memory in active place avoidance task is allothetic, with mice able to learn reversed shock zone location. (A) Schematic of experimental design and specific testing days. (B) Schematic of the shock zone location (red boundary) and visual cues during the 5-day paradigm (days 1–5 of testing, left), day 6 (“white barrel”, middle), and reversal learning (days 7–11, right). (C) Number of entries into the shock zone during the 20-min trial over days 1–11 of the testing paradigm, measuring cumulative performance in the task; note that removal of visual cues (“white barrel”; day 6) impairs performance, as does changing the shock zone location (day 7–11). (D) Latency, i.e., time to first entry into the shock zone. (E) Examples of tracks and mean heat maps of mice during days 1–5, “white barrel” (day 6), and reversal learning (days 7–11). The gray line represents the path of a single mouse, with entry into the shock zone (red boundary) eliciting a shock (red circles). Heat maps represent the merged maps of all mice, where the color of a pixel represents the average trajectory of a track at that location (blue = low, red = high proportion of time; n = 12). All data is represented as mean ± SEM; *P < 0.05, **P < 0.01, ***P < 0.001, n = 12.

