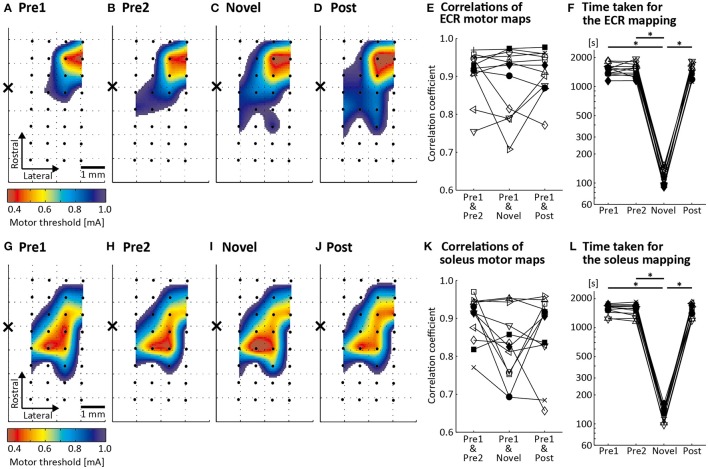
Figure 3.
Results of motor mapping by cortical surface stimulation (CSS). Topographical spatially interpolated ECR (A–D) and soleus (G–J) motor maps from one representative rat. The color scale reflects the MT. Black dots and the cross in each panel indicate the location of the 32 stimulating electrodes and of the bregma, respectively. Motor maps of Pre1, Pre2, and Post conditions were assessed using the conventional CSS mapping procedure (conventional MT criterion and stimulus frequency of 1 Hz). Motor map of the Novel condition was assessed using the novel CSS mapping procedure (newly proposed MT criterion and stimuli repeated at 4 Hz). (E,K) Spearman's correlation coefficient calculated for three different pairs of motor maps in 12 rats: between the Pre1 and Pre2 conditions, between the Pre1 and Novel conditions and between the Pre1 and Post conditions. (F,L) Time taken for the mapping procedure in the 12 animals in the four conditions. Each line represents one animal. *p < 0.01.

