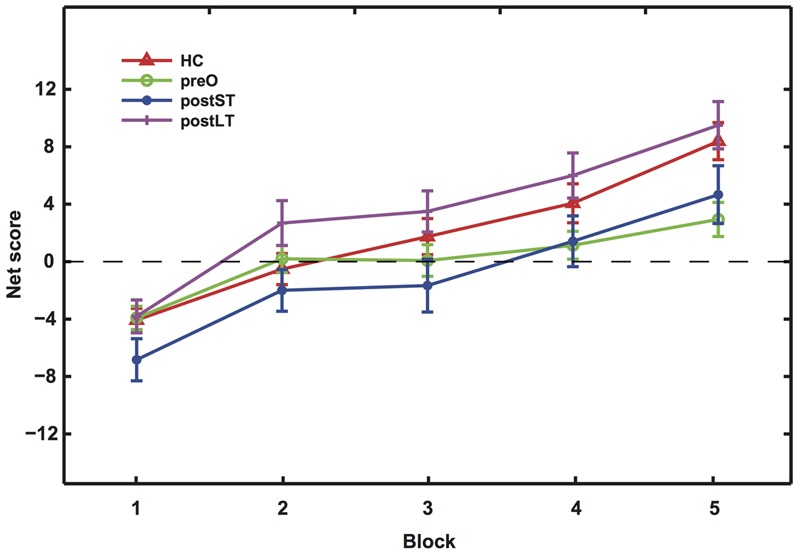
FIGURE 1.

The net scores of the five blocks during the IGT. Mean net scores for each block were calculated as (C + D) – (A + B). The four curves represent the four participant groups as indicated by the legend labels. In Blocks 2 and 3, the postLT group’s scores were significantly higher than that of the postST group (p = 0.007); in Blocks 4 and 5, both the HC and postLT groups achieved significantly higher scores than the pre-operative group (pHC = 0.0355; ppostLT = 0.0012).
