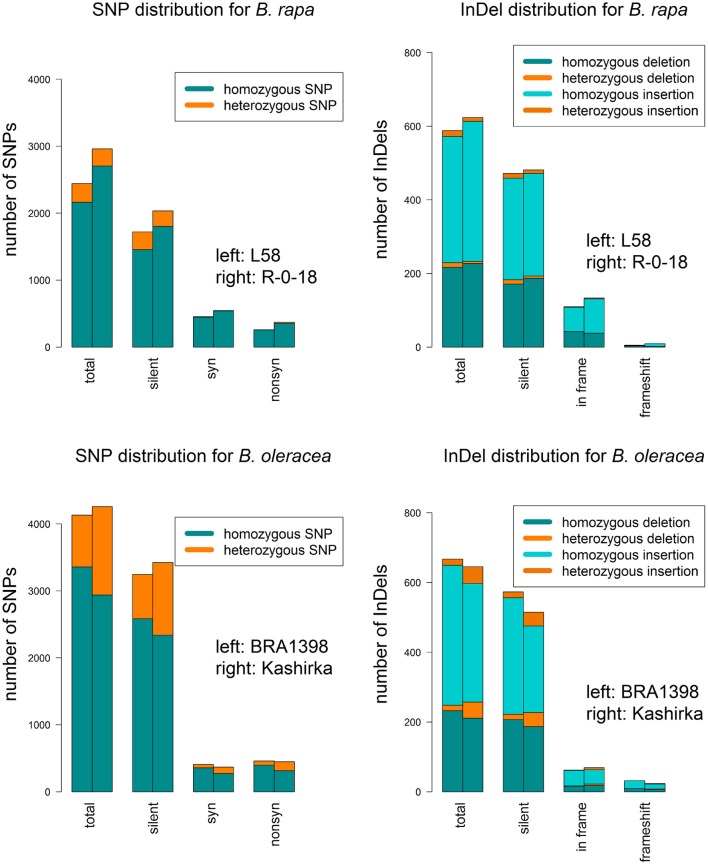
Figure 4.
SNP and InDel distribution for both sequenced genotypes for each B. rapa and B.oleracea. For SNPs, the barplots show the total number of SNPs (total) and their distribution on silent SNPs (silent), synonymous SNPs (syn) and non-synonymous SNPs (non-syn). For InDels, they show the total number of InDels (total) and their distribution on silent InDels (silent), in-frame variants (in frame) and frameshift InDels (frameshift). Splice variants were not displayed, as they were rare. Homozygous and heterozygous SNPs are color-coded.

