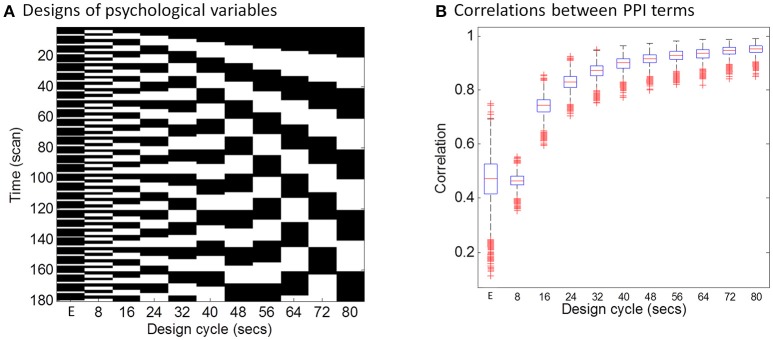
Figure 1.
Simulations of the correlations between PPI terms calculated from deconvolution and non-deconvolution methods. (A) Illustrates different task designs that were used for the simulation. Each column represents a task design. E in the x axis represents the event-related design, with 1 time bin (2 s) of the trial condition and 5 time bins (10 s) of the baseline condition. The remaining columns show block designs with different frequencies of repetition. For example, 80 s cycle means 40-s on and 40-s off of the task condition related to the baseline. Physiological variables at the neuronal level were generated using Gaussian random variables for 1,000 times. (B) Shows boxplots of correlations across the 1,000 simulations between PPI terms calculated from two methods: (1) the two simulated variables were convolved with the HRF and then multiplied to form the PPI term; (2) the two simulated variables were multiplied and then convolved with the HRF.

