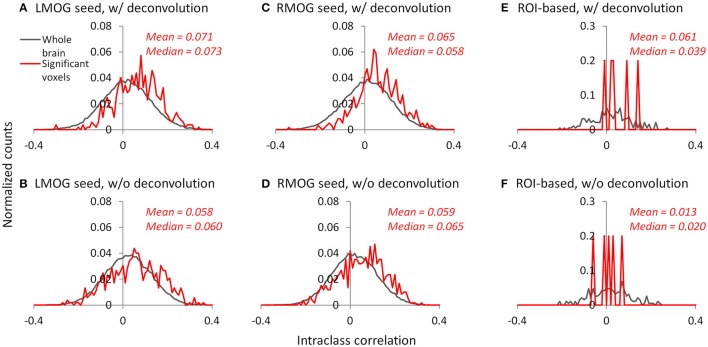
Figure 10.
Histograms (normalized) of intraclass correlations of PPI effects between the two TR runs across the whole brain (gray lines) and in statistically significant voxels or effects (red lines). (A–C) Show the results of the left middle occipital (LMOG) seed, right middle occipital (RMOG) seed, and ROI-based analysis using the deconvolution method, respectively. (D–F) Show the results of the LMOG seed, RMOG seed, and ROI-based analysis using the non-deconvolution method, respectively. The significant voxels or effects were determined using intersection of the two runs and two methods each thresholded at p < 0.01.

