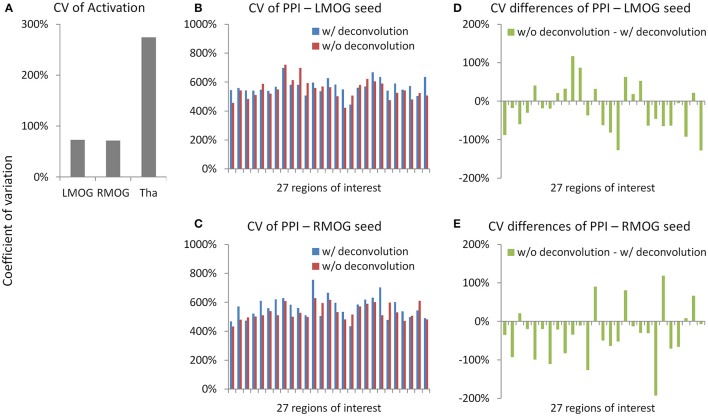
Figure 11.
Measurement errors as revealed by coefficients of variations (CV) (Bland and Altman, 1996) for the activation (A) and psychophysiological interaction (PPI) results (B,C). Please notice the different scales in y axes. (D,E) Demonstrate the differences of CV on PPI effects between the deconvolution and non-deconvolution methods. LMOG, left middle occipital gyrus; RMOG, right middle occipital gyrus; Tha, thalamus.

