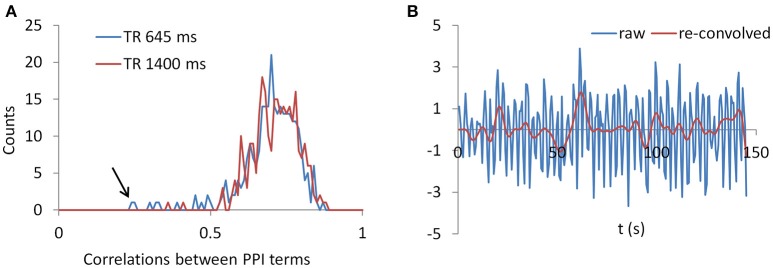
Figure 12.
(A) Histograms of correlations between PPI terms with and without deconvolution across all subjects from both the LMOG and RMOG ROIs for the two TR runs. (B) For the worst case as spotted by the black arrow in (A), we show the raw time series and the time series with deconvolution and re-convolution with hemodynamic response function.

