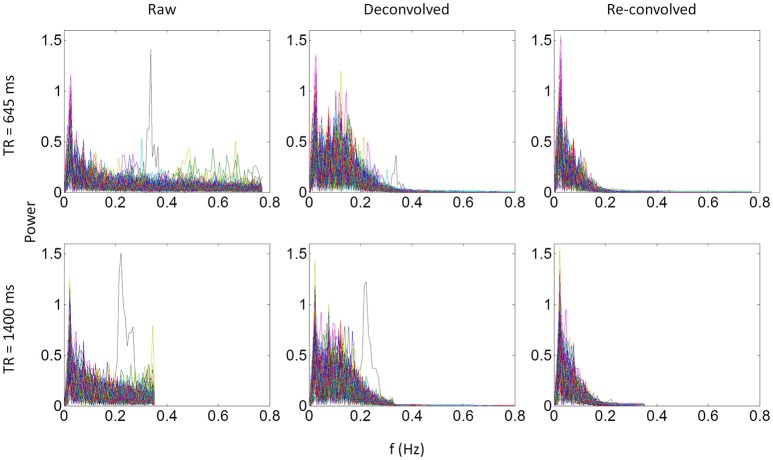
Figure 13.
Power spectrums of time series from the right middle occipital gyrus seed for each of the 138 subjects for the 645 ms run (upper panels) and 1,400 ms run (lower panels). Each line in a plot represents one subject. Left, middle, and right panels show the power spectrum of the raw, deconvolved, and re-convolved time series, respectively.

