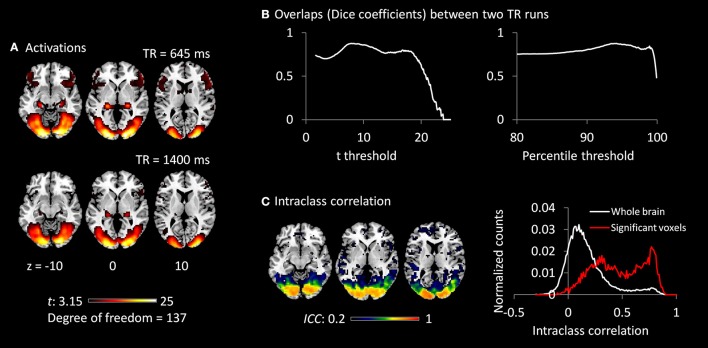
Figure 3.
(A) Activations (t maps) of visual checkerboard presentation for the 645 ms TR run (upper) and 1,400 ms TR run (lower). The threshold t-value corresponds to one-tailed significance at p < 0.001. (B) Overlaps (Dice coefficients) between the two TR runs using t threshold (left) and percentile threshold (right). (C) Test–retest reliability map (intraclass correlations, ICC) of activations between the two runs is shown on the left, which were thresholded at ICC > 0.2. The histograms of ICC of activations between the two TR runs in significant voxels and whole brain are shown on the right. The significant voxels were determined using intersection of the two runs each thresholded at p < 0.001.

