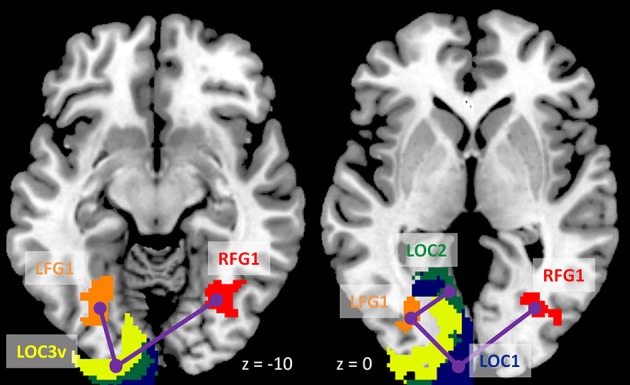
Figure 8.

Illustration of consistently reduced connectivity during checkerboard presentation compared with fixation in the ROI-based (region of interest) psychophysiological interaction (PPI) analysis in the two TR (repetition time) runs and two methods. Numbers on the bottom represent z coordinates in MNI (Montreal Neurology Institute) space.
