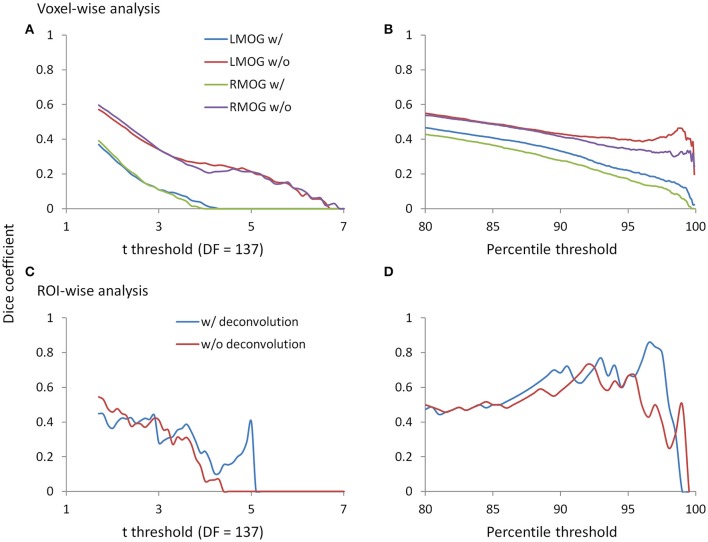
Figure 9.
Dice coefficients of thresholded negative PPI effects between the two TR runs as functions of t threshold and percentile threshold for the voxel-wise analysis (upper panels) and ROI-wise analysis (lower panels). (A) Dice coefficients of negative PPI effects from the voxel-wise analysis between the two TR runs using the t threshold. (B) Dice coefficients of negative PPI effects from the voxel-wise analysis between the two TR runs using the percentile threshold. (C) Dice coefficients of negative PPI effects from the ROI-wise analysis between the two TR runs using the t threshold. (D) Dice coefficients of negative PPI effects from the ROI-wise analysis between the two TR runs using the percentile threshold. The lowest t used for calculating overlap is 1.7, which approximately corresponds to p < 0.05. The lowest percentile is 80, which is approximately corresponds to the largest proportions of voxels at p < 0.05.

