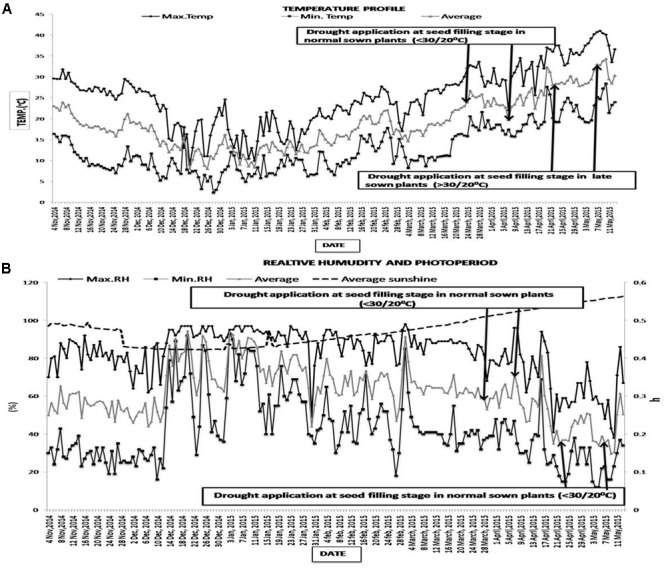
FIGURE 1.

(A) Maximum, minimum and mean air temperatures (°C), and (B) relative humidity (%), photoperiod (h) at the experimental site from 4 November 2014 to 13 May 2015. The arrows show the time that the drought treatment was imposed (first arrow) and completed (second arrow) on lentil sown in November 2014 (normal sowing) and February 2015 (late sowing).
