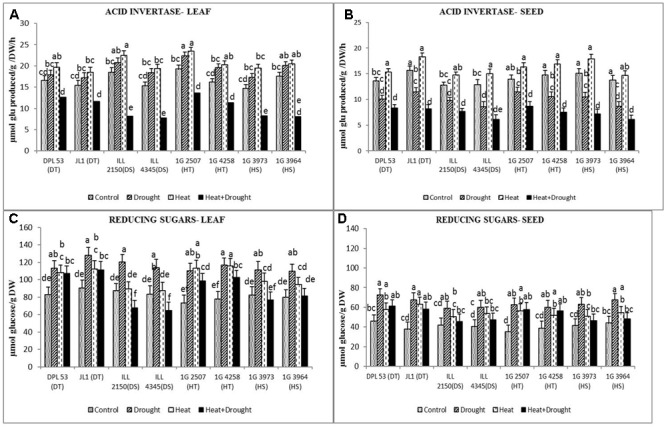
FIGURE 7.

Add invertase activity in (A) leaf and (B) seed and reducing sugars concentration in (C) leaf and (D) seed in eight lentil genotypes contrasting for heat tolerance (HT), heat sensitivity (HS), drought tolerance (DT) and drought sensitivity (DS) in the normal-sown well-watered treatment (Control), normal-sown drought-stressed treatment (Drought), late-sown well-watered treatment (Heat), and late-sown drought-stressed treatment (Heat + Drought). LSD values (genotype × treatment) for (A) acid invertase activity in leaf = 2.2, (B) acid invertase activity in seed = 1.7, (C) reducing sugars concentration in leaf = 8.3, (D) reducing sugar concentration in seed = 7.4. Values are means + SEM. (n = 3). Different letters on the vertical bars indicate significant differences between means.
