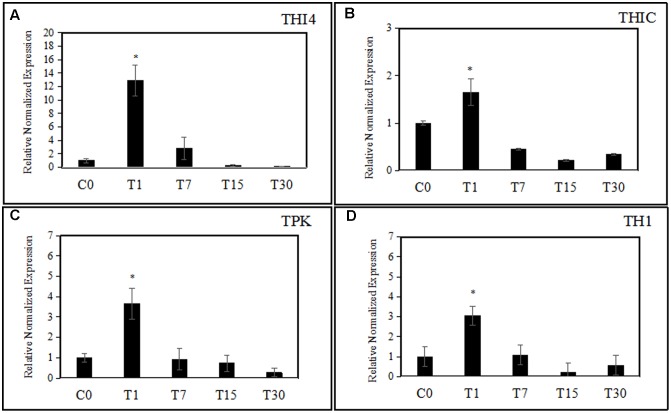
FIGURE 3.
(A–D) The effect of colonization of H. toruloidea on the expression of THI4, THIC, TH1, and TPK. C0: control, T1: 1 day post-inoculation, T7: 7 days post-inoculation, T15: 15 days post-inoculation, T30: 30 days post-inoculation. Error bars indicated SD of three biological replicates. Asterisks indicate significant differences when compared to controls using Student’s t-test (p < 0.05).

