
Figure 1.
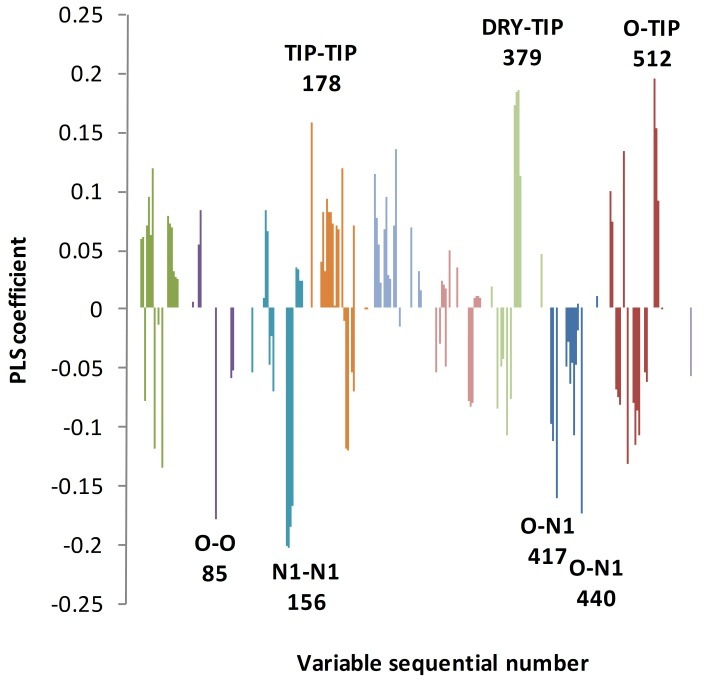
2LV PLS coefficient plots for the obtained model. The most intensive variables are labeled by sequential numbers. 2LV indicates 2 latent variables; PLS, partial least squares.
Official websites use .gov
A
.gov website belongs to an official
government organization in the United States.
Secure .gov websites use HTTPS
A lock (
) or https:// means you've safely
connected to the .gov website. Share sensitive
information only on official, secure websites.
2LV PLS coefficient plots for the obtained model. The most intensive variables are labeled by sequential numbers. 2LV indicates 2 latent variables; PLS, partial least squares.