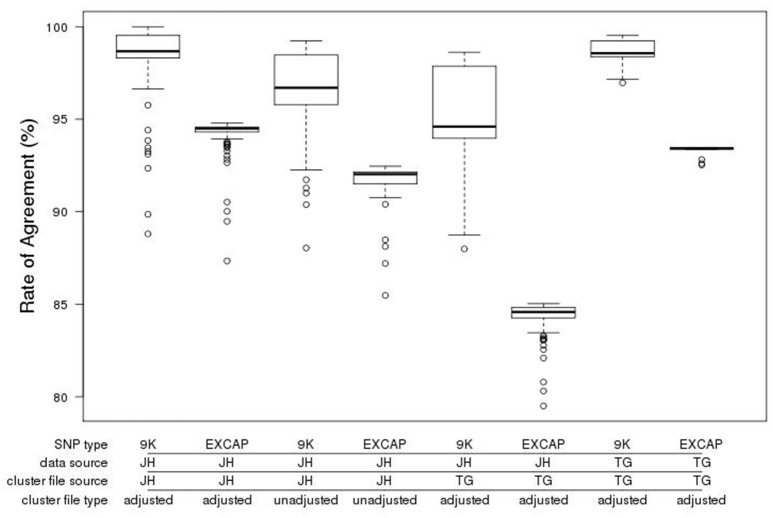
Figure 4.
Boxplot of genotype call agreement rate (%) from the comparison of calls from the exome capture variant calling and the GenomeStudio calls for the accessions genotyped with the new 50k chip. The data shown is categorised by the provenance of the SNPs (9k = SNPs from the existing 9k chip, EXCAP SNPs = SNPs from exome capture data that are new and exclusive to the 50k chip), the source and type of cluster file (JH, James Hutton; TG, TraitGenetics, adjusted vs. unadjusted) and the source of the 50k genotype call set used (JH vs. TG). Bold horizontal lines represent the median, box boundaries upper and lower quartiles, whiskers maxima and minima, and open circles represent outliers.

