
FIGURE 1.
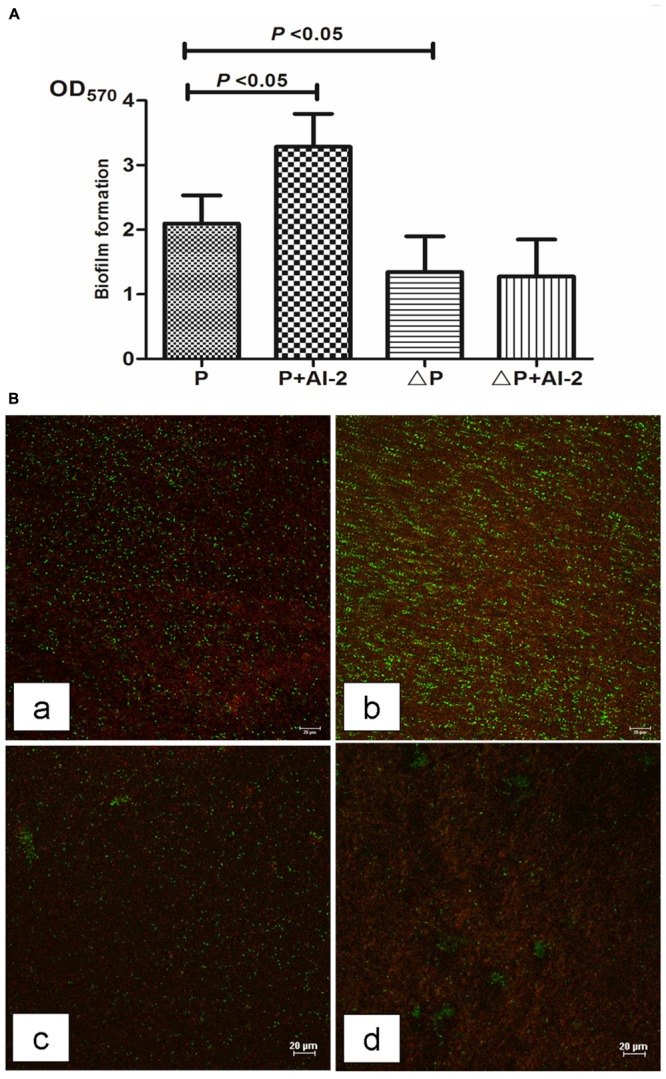
Effects of AI-2 on P. aeruginosa PAO1 biofilm formation. P, PAO1 group; P+AI-2, PAO1+AI-2 group; ΔP, P. aeruginosa lasR rhlR mutant group; ΔP+AI-2, P. aeruginosa lasR rhlR mutant+AI-2 group. (A) Biofilm formation was assessed by crystal violet. Error bars represent SD and all experiments were performed in three times independently (n = 24); (B) Representative confocal laser scanning micrographs of biofilms in four groups. Compared to the PAO1 control group (a), a dense and compact biofilm and more live bacteria were observed under CLSM in P+AI-2 group (b) and a loosend biofilm structure and fewer viable cells were visualized in the ΔP+AI-2 group (c) and ΔP group (d). Red, non-viable cells; green, viable cells. scale bars = 20 μm.