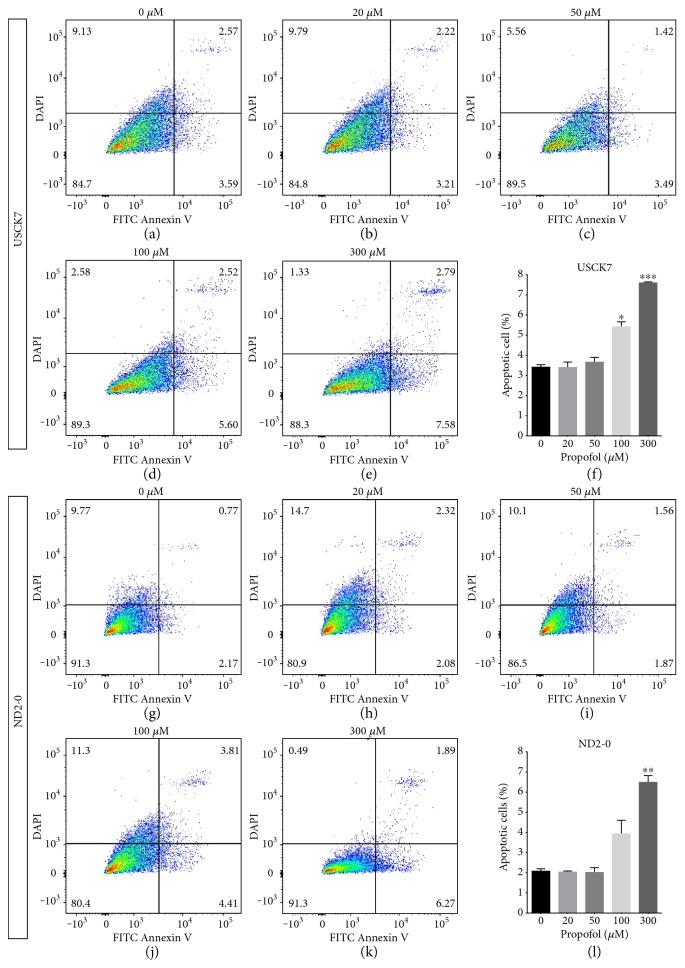
Figure 3.
Propofol-induced apoptosis in NPCs. NPCs derived from USCK7 and ND2-0 were treated with propofol at 0, 20, 50, 100, and 300 μM for 6 h and apoptotic cells quantified by flow cytometry of FITC-labelled Annexin V. The percentage of different cell populations is shown in each of the four quadrants of the representative flow cytometry charts, and the statistical analyses are summarized in (USCK7) (f) and (ND2-0) (i). The percentage of apoptotic cells is shown at the left lower quadrant of each chart. For USCK7-NPCs, the 100 and 300 μM propofol treatment groups showed significantly higher percentage of apoptotic cells (a, b, c, d, e, f). For ND2-0 NPCs, only the 300 μM treatment group showed a significantly higher percentage of apoptotic cells (g, h, i, j, k, l). Data were expressed as a percentage of FITC+/DAPI− cells (mean ± SD) for n = 3 flow cytometry experiments per treatment condition. ∗p < 0.05; ∗∗p < 0.01; ∗∗∗p < 0.001.

