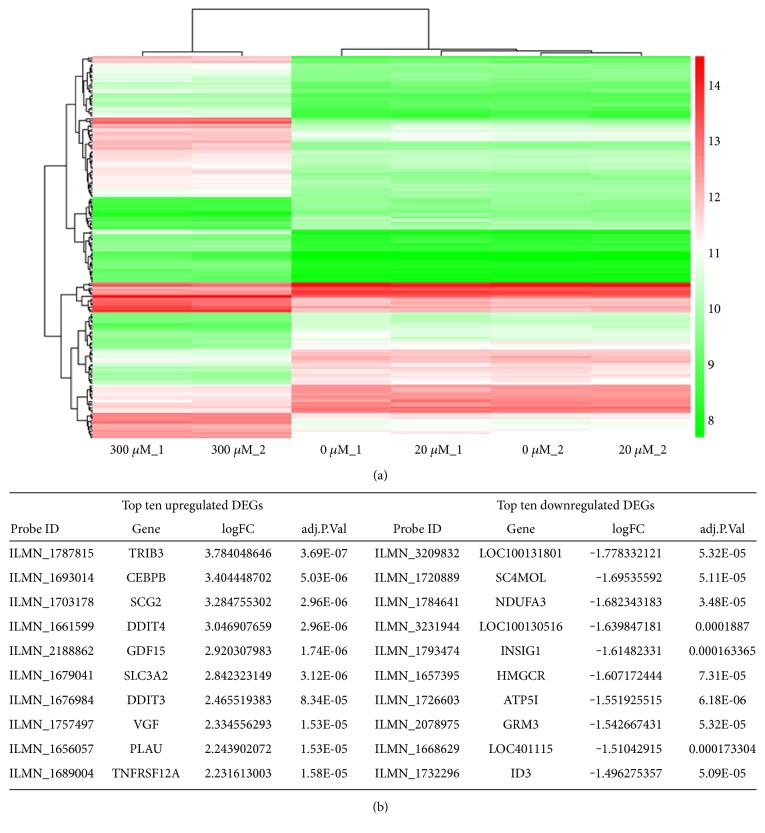
Figure 5.
Gene expression profile of propofol-treated NPCs. NES-GFP iPSC-derived NPCs were treated with propofol (20 μM or 300 μM) for 6 h, and RNAs extracted immediately for Illumina BeadArray. Heatmap (a) of hierarchical clustering of differentially expressed genes (DEGs) shows that the 20 μM propofol-treated group clustered together with the untreated group, while the 300 μM propofol-treated group shows distinct gene expression profile. The top ten upregulated and downregulated DEGs are listed in (b).

