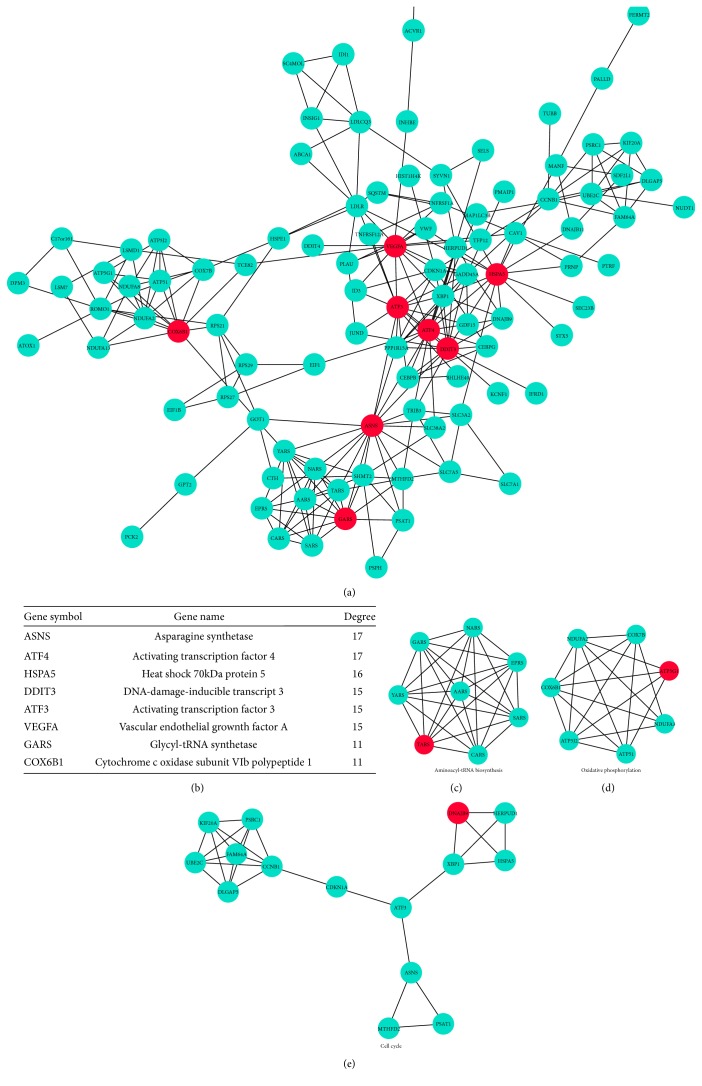
Figure 6.
PPI network construction of DEGs extracted from comparison of treated (300 μM) with untreated NPCs. The PPI relationships of the DEGs were obtained by using search tool for the retrieval of interacting genes (STRING) and visualized using the Cytoscape 3 software. After filtering out disconnected DEGs, a network with 101 nodes and 251 edges were obtained with the combined score > 0.4 (a). The connectivity degree of each node of the PPI network was calculated. Eight genes with connectivity degree > 10 were selected as hub genes (b). Clusters with densely connected regions based on topology were built with Molecular COmplex DEtection (MCODE). The top three subnetworks represent important cellular and molecular pathways including aminoacyl-tRNA biosynthesis (c), oxidative phosphorylation (d), and cell cycle (e).

