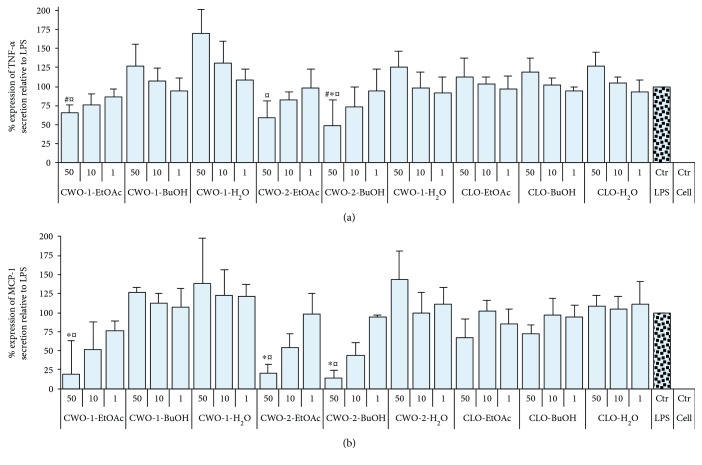
Figure 3.
ELISA results for relative response of TNF-α and MCP-1 in LPS-treated THP-1 cells. Each extract was tested at three different concentrations (50 μg/ml, 10 μg/ml, and 1 μg/ml), and the results are presented as mean with SD displayed as positive bars (n = 3). (a) TNF-α secretion relative to control. ∗p < 0.05 compared to LPS control. #p < 0.05 compared to CLO-BuOH 50 μg/ml. ¤p < 0.05 compared to CLO-H2O 50 μg/ml. (b) MCP-1 secretion relative to control. ∗p < 0.001 compared to LPS control. ¤p < 0.001 compared to CLO-H2O 50 μg/ml. TNF-α = tumor necrosis factor-alpha; MCP-1 = monocyte chemoattractant protein-1; LPS = lipopolysaccharide; CWO = cold-pressed whale oil; CLO = cod liver oil; EtOAc = ethyl acetate; BuOH = butyl alcohol.

