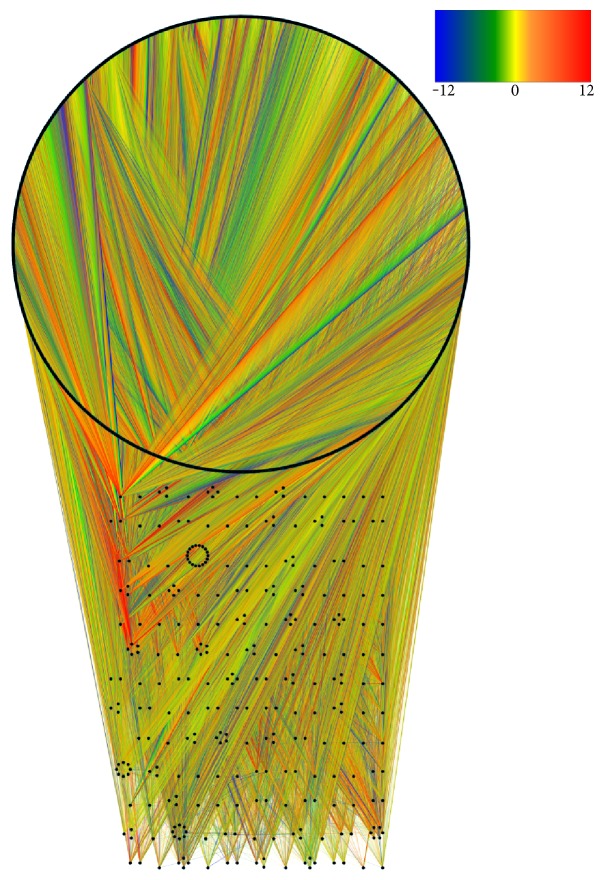
Figure 2.
Transcription factor network constructed from the FANTOM4 Edge Express database. In this representation, nodes are represented by black dots. The color of the links depends on the value of the interaction: blue and green are repressions; yellow, orange, and red are for activations. The circle on top of the figure corresponds to target genes, that is, their out-degree = 0.

